
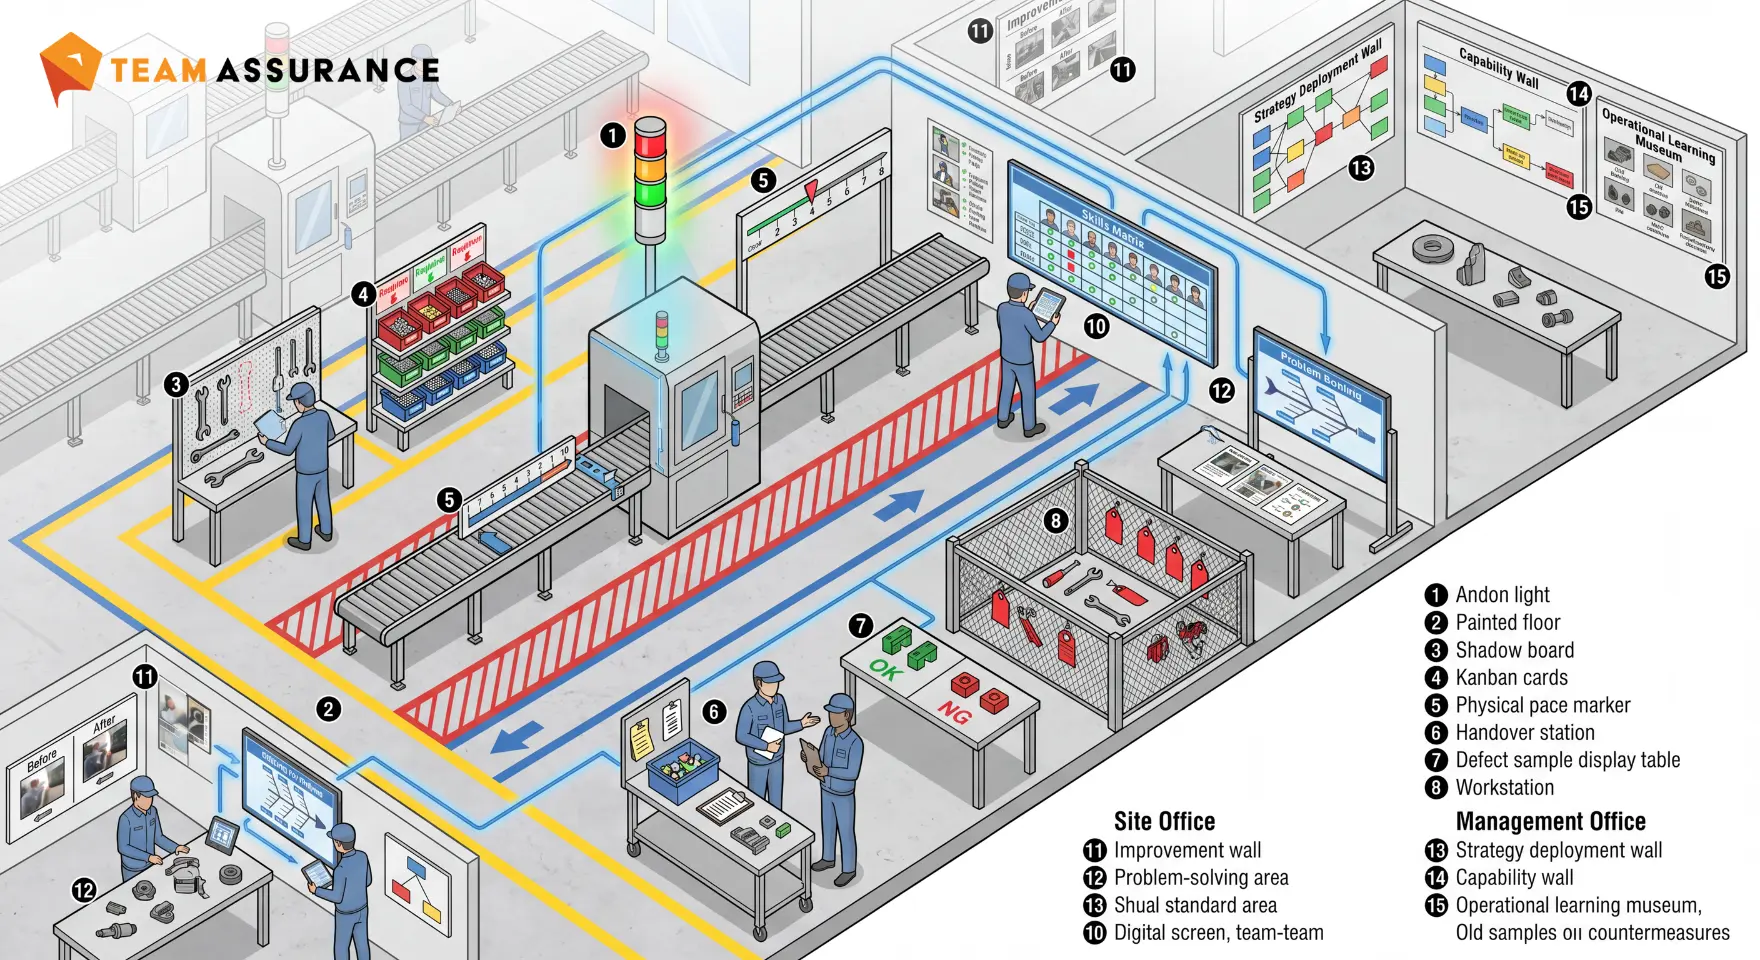
Visual management is one of the most practical ideas in lean.
Done well, it gives people a clearer view of the work, a faster way to understand what needs attention, and a better rhythm for improvement. It makes the current condition visible. It helps teams see the gap between standard and actual. It gives leaders a way to support the work without guessing. It turns improvement from something discussed occasionally into something managed every day.
That is the useful version.
Visual management is not about making the workplace look lean. It is not about colourful boards, clever charts, floor markings, dashboards, signs or software for their own sake. Those things can help, but only when they make the work easier to understand and easier to improve.
The real purpose is simple. Make the work visible enough that people can see what is happening, understand what matters, and act with confidence.
That is why visual management sits so naturally inside lean methodology. Lean is about creating value, improving flow, developing people, and removing waste from the system. Visual management supports all of that by making the condition of the work easier to see.
Good operations do not rely on people guessing. They make reality visible.
What visual management means
Visual management is the use of visual signals, displays, controls and routines to show the current condition of work. It helps people understand what should be happening, what is actually happening, and where support or action is required.
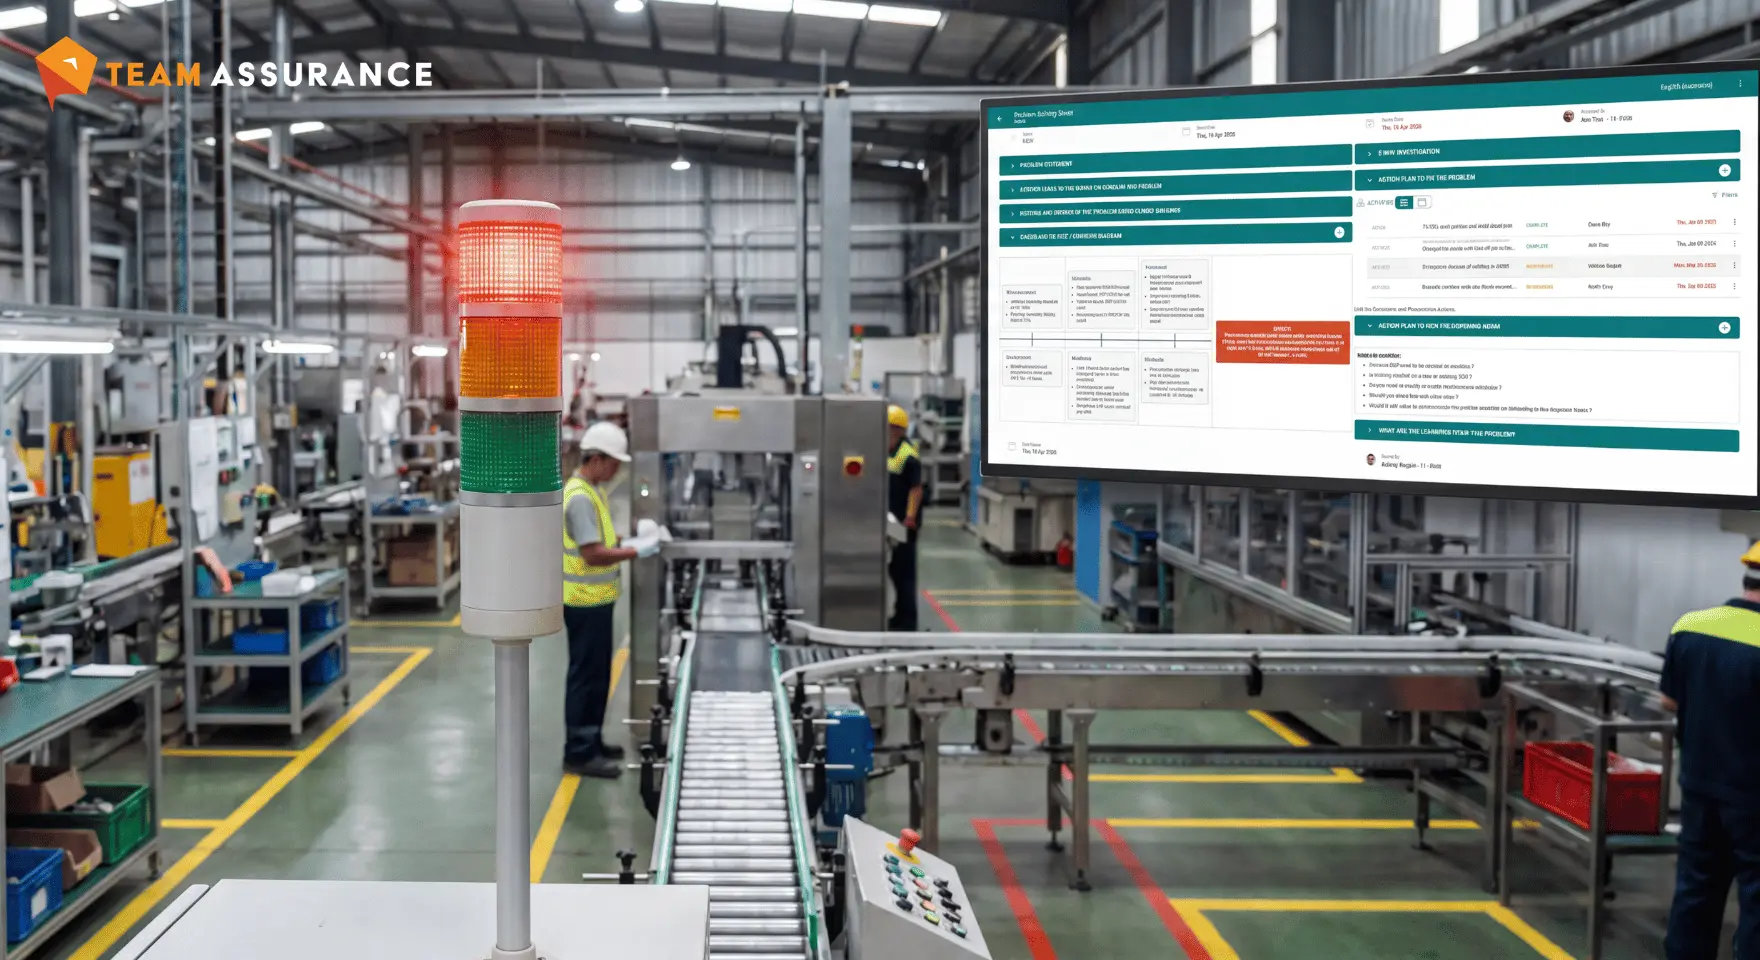
It can be as simple as a marked location for tools, a kanban card, a colour-coded status, a production board, an andon light, a skills matrix, a standard work display, a tier meeting board, or a digital dashboard.
The format matters less than the function.
A good visual system answers useful questions quickly. Are we on plan? Is the work flowing? Is there an abnormality? Who owns the next action? Has the issue been escalated? Is the standard clear? Has the lesson been captured? Are we improving?
That is what makes it powerful. It reduces ambiguity. It gives people a shared picture. It helps teams move from opinion to evidence.
That sounds basic. Good. Most good management is basic when stripped of theatre.
Why visual management matters in lean
Lean works best when problems are visible and people are supported to improve them.
Visual management helps create that environment. It allows teams to see the work clearly and respond earlier. It gives supervisors and leaders a practical way to coach, support and remove barriers. It helps the organisation shift from delayed reporting to active management.
In a strong lean system, visual management does not exist as a side activity. It is part of the operating rhythm. Teams use it to manage daily work. Leaders use it to understand where support is needed. Improvement teams use it to see patterns. Senior leaders use it to understand whether the management system is working.
That is the point. Visual management connects people to the work.
It also helps create a more honest and constructive culture. When problems are visible early, they are easier to deal with. A red indicator does not have to mean failure. It can mean the system is working because the team has made the abnormality visible before it becomes more expensive.
That is a healthier way to run an operation.
The lean principles behind visual management
Visual management supports the main principles of lean because it makes them easier to practise.
Lean starts with value. The organisation needs to understand what matters to the customer and focus its effort there. Visual management helps teams see whether their work is creating that value or drifting away from it. The best visual systems show what matters most, not everything that can be measured.
Lean also depends on flow. Work should move smoothly, with fewer delays, stops, handoffs, rework and interruptions. Visual management helps teams see where flow is strong and where it needs attention. A blocked process, a delayed decision, a recurring defect, a missing material, or an overloaded team can be made visible before it quietly damages performance.
Pull systems also rely heavily on visual signals. Kanban, replenishment signals, WIP limits and simple status indicators all help people respond to actual demand rather than guesswork. When these signals are clear, teams can work with better timing and less overproduction.
Continuous improvement is another obvious connection. Improvement begins with seeing the gap. Visual management makes the gap between current condition and target condition visible. It gives teams something specific to improve.
Respect for people is part of this too. People do better work when the system around them is clear. Visual management supports people by reducing confusion, making standards easier to follow, and showing where help is needed.
That is not soft. It is practical.
Value stream mapping and visual thinking
Value stream mapping is one of the best examples of visual management in lean.
It gives teams a way to see the full flow of work, not just their own section of it. It shows process steps, waiting, handoffs, queues, information flows, rework, delays and bottlenecks. It helps people understand where value is created and where effort is being lost.
That matters because many organisations are full of good people working hard inside disconnected processes. Each department may be trying to do the right thing, but the total flow can still be slow, clumsy or full of waste.
A value stream map helps the business see the whole system.
The best organisations use that visibility to focus improvement. They do not treat the map as a workshop output and leave it there. They connect it to action. They use it to decide what should improve, who needs to be involved, what the future state should look like, and how progress will be managed.
That is where visual thinking becomes operational improvement.
Continuous improvement needs clear signals
Continuous improvement works best when teams can see what to improve.
Visual management gives continuous improvement a practical starting point. It shows where performance is off standard, where problems are repeating, where actions are stuck, where handovers are weak, where quality is drifting, or where support is needed.
This is what helps teams move from general frustration to focused improvement.
Instead of saying, "We need to get better," the team can say, "This specific issue is repeating on this shift, after this changeover, with this material, and the current countermeasure is not holding."
That is useful. That is something people can work with.
Good visual management also helps teams see whether improvement is actually happening. It does not just show the problem. It shows actions, ownership, follow-up, learning and results. The team can see whether the countermeasure worked. If it did, the standard can improve. If it did not, the team can learn and adjust.
That is a proper improvement loop.
Waste becomes easier to remove when people can see it
Waste is much easier to remove when it is visible.
Visual management helps expose waiting, defects, excess movement, rework, over-processing, missing information, poor handovers, excess inventory, overloaded teams and unused capability. Once these things are visible, teams can improve them.
This is one of the great strengths of lean. It does not ask people to work harder inside a messy system. It asks people to see the system more clearly and improve it.
Visual management gives people a shared way to do that.
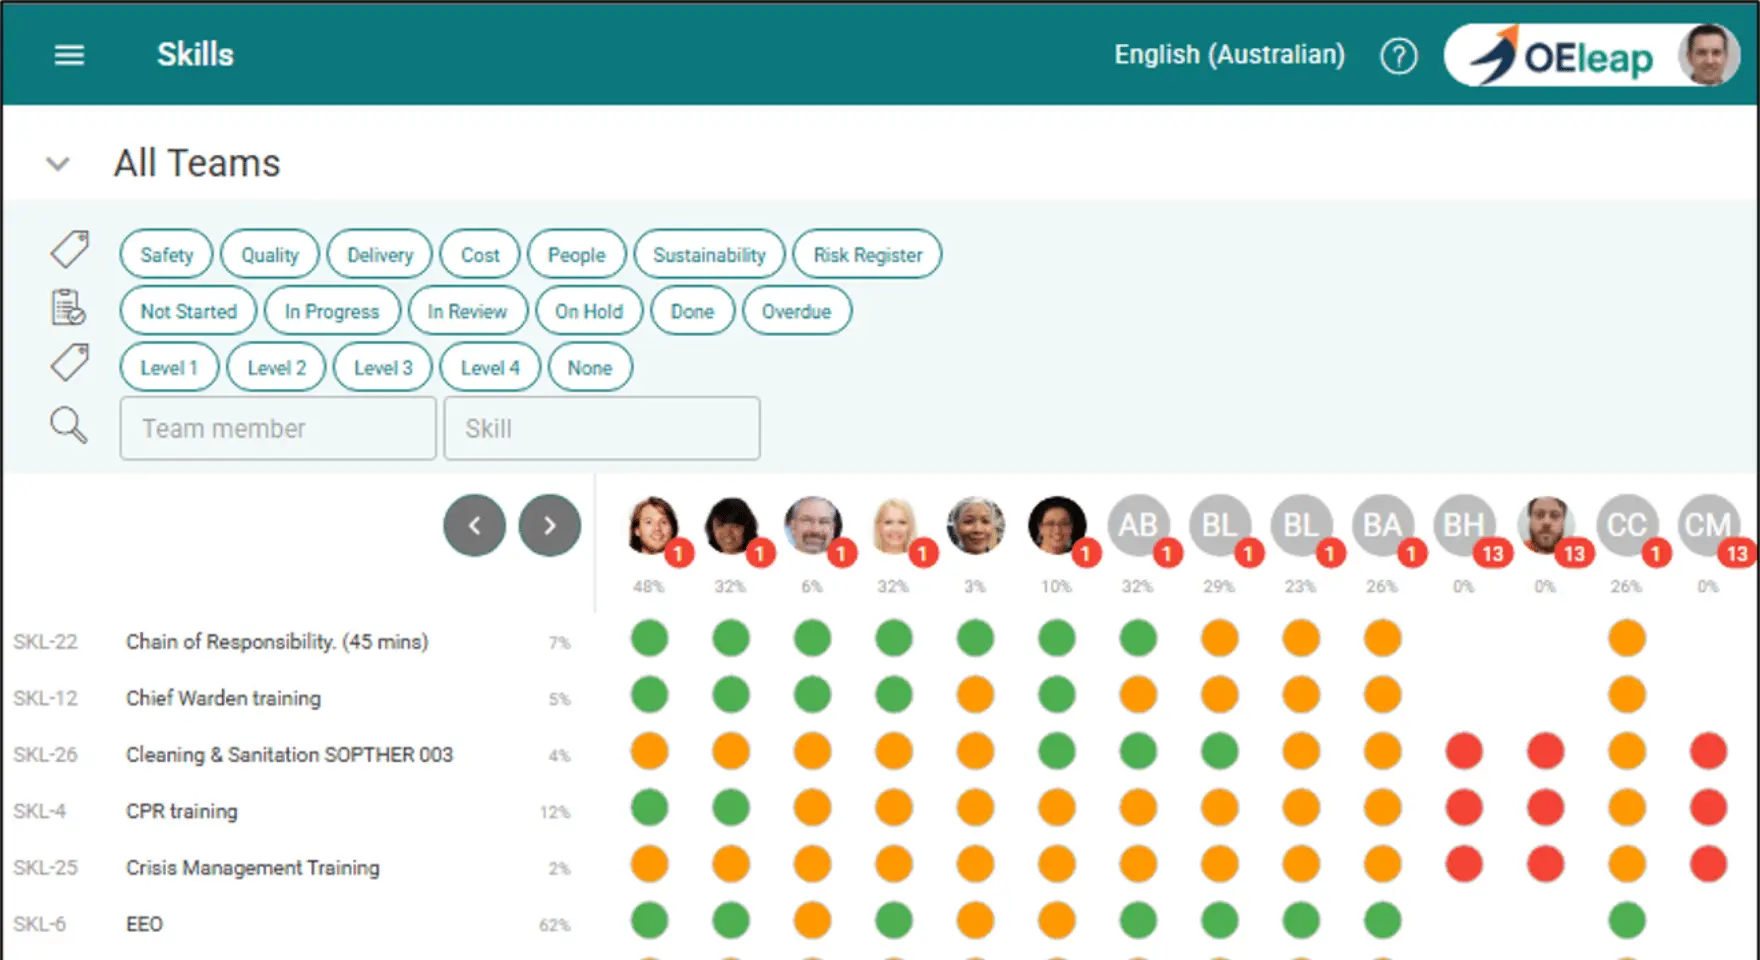
A clear kanban signal can reduce overproduction. A visible defect trend can trigger better problem solving. A simple skills matrix can expose a training gap before it becomes a production problem. A maintenance visual can show recurring equipment issues. A tier board can show where support is needed. A project board can show blocked actions and decisions.
None of this needs to be complicated. In fact, it usually works better when it is not.
Integrating visual management into daily lean practice
Visual management works best when it is woven into the way the business runs.
In daily management, visual tools show the team's current condition. They help people understand safety, quality, delivery, cost, people and improvement priorities. They support short, focused conversations about what is normal, what is abnormal, and what needs action.
In standard work, visual management helps people understand the current best-known way to do the job. It can show key steps, checks, timing, safety points, quality requirements and escalation triggers. This makes standards easier to follow and easier to improve.
In problem solving, visual management helps make the thinking visible. A3s, cause-and-effect diagrams, problem boards and action tracking all help teams see the problem, understand the cause, test countermeasures and confirm the result.
In project management, visual tools help teams see progress, blockers, risks, owners and decisions. This is especially useful when projects involve multiple functions, shifts or sites. Good visual project management reduces chasing and increases clarity.
In leadership routines, visual management helps leaders focus on the right work. Leaders can see where support is needed, where standards are holding, where improvement is moving, and where the system needs attention.
That is how visual management becomes part of the operating system, not a side decoration.
Visual project management tools
Visual project management tools are useful when they make work easier to coordinate.
Good project work needs clarity. What are we trying to achieve? What is the next step? Who owns it? What is blocked? What decision is needed? What has changed? What risk needs attention?
A strong visual project management system gives the team one place to see that. It reduces confusion. It helps people understand progress. It makes blockers visible. It helps leaders support the team earlier.
This is where digital tools can be very powerful. Physical boards work well in one area. Digital visual management works better when teams are spread across sites, shifts, countries or functions. It allows the same operating rhythm to extend across the organisation.
The important thing is that the tool supports the management process. The software should help the team see, act, learn and follow through. When that happens, it becomes a multiplier.
Good tools do not replace management discipline. They make good discipline easier to practise.
Real-time dashboards and displays
Please accept cookies to access this content
They help teams see current performance and respond quickly. They can show production status, downtime, safety, quality, delivery, maintenance, energy, inventory, service levels or other critical measures. When the information is timely and relevant, the team can make better decisions.
The best dashboards are focused. They show the right information at the right level.
Frontline teams need to see what is happening now and what needs attention during the shift. Middle leaders need to see patterns, recurring barriers and support needs. Senior leaders need to see system-level performance, risk, capability and improvement priorities.
That layered approach matters. It keeps each level focused on the work it can actually influence.
A good dashboard should not overwhelm people. It should sharpen attention. It should help people move from data to action.
That is the standard.
Visual controls and signage
Visual controls are often simple and extremely effective.
A marked tool location saves time and reduces searching. A floor line improves safety and flow. A kanban card triggers replenishment. A colour-coded status makes abnormality obvious. A red tag shows equipment that needs attention. A skills matrix helps supervisors see capability coverage. A standard work display helps people follow the current method.
These are small things, but small things repeated every day become big things.
The best visual controls remove the need for explanation. People can see the correct condition quickly. They can see when something is out of place. They can act without needing to ask, chase or guess.
That is good design.
Visual controls are not about making the site look neat for visitors. They are about making the work easier, safer and more reliable for the people who do it.
That is a much better reason.
Successful implementations
Strong visual management implementations usually have a few things in common.
They start with a real operational need. The team is not building a board because someone said lean needs boards. They are solving a problem. Maybe handovers are weak. Maybe actions are not closing. Maybe defects are being found too late. Maybe escalation is slow. Maybe projects are drifting. Maybe training gaps are hard to see.
The visual system is built around that need.
They involve the people doing the work. Operators, supervisors, maintenance, quality, planning and support functions all see different parts of the operation. When those people help design the system, it is much more likely to be useful.
They connect visibility to action. A good visual board is not a noticeboard. It is a management point. It shows the condition, triggers discussion, clarifies ownership and supports follow-up.
They keep improving the system. The first version does not need to be perfect. It needs to be used, tested and improved. Over time, the team removes clutter, sharpens the measures, improves the routine and makes the system more useful.
That is how visual management matures.
Lessons from the best operators
The best operators treat visual management as a practical leadership habit.
They use it to see reality earlier. They use it to ask better questions. They use it to coach. They use it to align teams. They use it to make improvement part of normal work.
They also keep it simple. They avoid stuffing every possible metric onto a board. They choose the few signals that matter. They make ownership clear. They make the next action obvious. They make escalation useful.
They understand that visual management is not about control from a distance. It is about support close to the work.
That distinction matters.
When teams trust the system, they use it. When they use it, the organisation learns faster. When the organisation learns faster, performance improves.
That is the flywheel.
Best practices for implementation
Start with purpose. Be clear about the problem the visual system is meant to solve. If the purpose is unclear, the board will become cluttered quickly.
Make the standard visible. People need to understand what should be happening. Without a standard, it is hard to tell whether the current condition is good, bad or drifting.
Keep the design simple. A good visual system should be understood quickly. Simple does not mean shallow. It means clear.
Build the routine. Decide who updates the display, when it is reviewed, what happens when something is abnormal, how actions are tracked, and how learning is captured.
Connect it to leadership behaviour. Leaders need to use the system consistently. They should respond to what is visible, support teams, remove barriers and coach through the work.
Review and improve it. If a metric no longer helps, remove it. If the board is hard to understand, simplify it. If the routine is weak, improve it. The visual system should evolve as the team learns.
That is the work.
Engaging team members
People engage with visual management when it helps them.
That is the blunt truth.
If the visual system helps the team get support, solve problems, reduce chasing, improve handovers, close actions and make work easier, people will use it. If it feels like extra admin, they will tolerate it for a while and then quietly drift away.
The best approach is to build visual management with the team, not for the team.
Ask what they need to see. Ask what gets missed. Ask what causes delays. Ask what information they chase. Ask what would help the next shift start better. Ask what problems keep repeating.
Then build from the answers.
Visual management should give people a stronger voice in the operation. It should help them show what is really happening and get the right support at the right time.
That is how engagement is built.
Clarity and simplicity
Clarity is the whole game.
A visual system should make the current condition easier to understand. It should show what matters, what is abnormal, who owns the next step, and what support is needed.
This applies to physical boards and digital systems. Digital tools can make visual management easier to scale, especially across sites and shifts. But the principle is the same. The system must help people understand and act.
A simple whiteboard with five useful signals can be better than a complex dashboard nobody trusts. A digital system with clear routines can be better than a physical board that only works when the right person is standing beside it.
The medium matters less than the usefulness.
Good visual management earns its keep.
Keeping displays current
A visual system builds trust when it stays current.
Teams need to know that what they are seeing reflects reality. That does not mean every display needs to update every second. It means the update rhythm should match the work.
Hourly production status may need frequent updates. Project actions may need daily or weekly updates. Skills matrices should update when training changes. Problem-solving boards should update as actions progress and learning is confirmed.
The rhythm should be clear. People should know when the information was updated and what it means.
When visual displays stay current, people trust them. When people trust them, they use them. When they use them, the system becomes stronger.
This is basic, and it matters.
Challenges and solutions
The common challenges are manageable when the purpose is clear.
Resistance usually reduces when people can see the benefit. If visual management helps teams get support, reduce confusion and solve problems faster, adoption becomes much easier. People are more willing to use a system that helps them do the job.
Consistency improves when leaders use the system properly. If leaders review the visuals, respond to abnormalities, follow up actions and coach through the process, teams see that the system matters. Leadership behaviour sets the tone.
Complexity reduces when the organisation is disciplined about simplicity. Keep the visual system focused on the work. Remove noise. Use plain language. Make ownership clear.
Stale displays improve when updating is built into the routine. Do not rely on heroic effort. Make the update part of how the work is managed.
None of this needs to be dramatic. It needs to be consistent.
The future of visual management in lean
The future of visual management is connection.
The next stage is not just more screens. It is better linkage between daily management, problem solving, standard work, skills, audits, maintenance, quality, safety, projects and strategy.
That is where digital systems and AI can help.
When the work is connected, the organisation can see more than isolated data. It can see relationships. A repeated quality issue can link to actions, training, equipment history, standards, supplier issues and previous countermeasures. A recurring downtime issue can connect to maintenance history, escalation patterns and improvement work. A leadership team can see not just performance, but the system behind performance.
That is useful.
AI becomes valuable when it can work from that connected operating history. It can help find patterns, surface repeated issues, connect lessons, suggest where attention is needed, and help new people understand the history behind the work.
That is not hype. That is practical.
The future of visual management is a smarter operating rhythm.
Building a culture of visual management
A culture of visual management is built by using it every day to run the business better.
Teams make the work visible. Leaders respond with support. Problems become easier to discuss. Standards become easier to follow. Actions become easier to manage. Lessons become easier to share. Improvement becomes part of the normal rhythm.
That is how visual management supports lean methodology.
It gives the organisation a clearer way to see, act and learn. It helps teams move faster with less confusion. It helps leaders support the right problems. It helps the business improve without relying on guesswork.
Used well, visual management is one of the simplest and most powerful ways to strengthen a lean operating system.
So the question is not whether the business has boards, dashboards or signs.
The question is whether people can see what matters, act with confidence, and learn fast enough to keep improving.
That is the standard worth building.
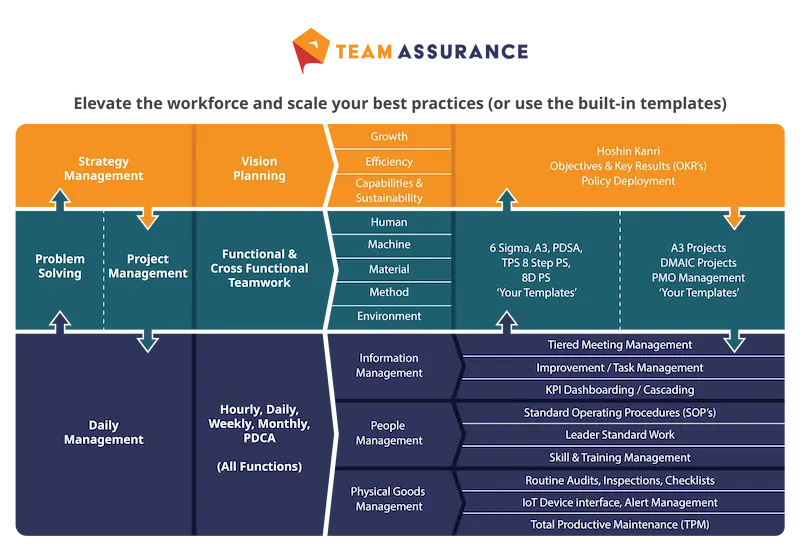
Visual management is most effective when it is part of a connected management system, not a collection of standalone boards and dashboards. The charts below illustrates how visual management works alongside daily management, problem solving, standard work and continuous improvement to make abnormalities visible, accelerate action and strengthen organisational learning
See how TeamAssurance transforms visual management into a driver of operational excellence. Book a demo to discover how our connected Operational Excellence platform helps organisations improve visibility, strengthen daily management and turn operational insights into continuous improvement.