
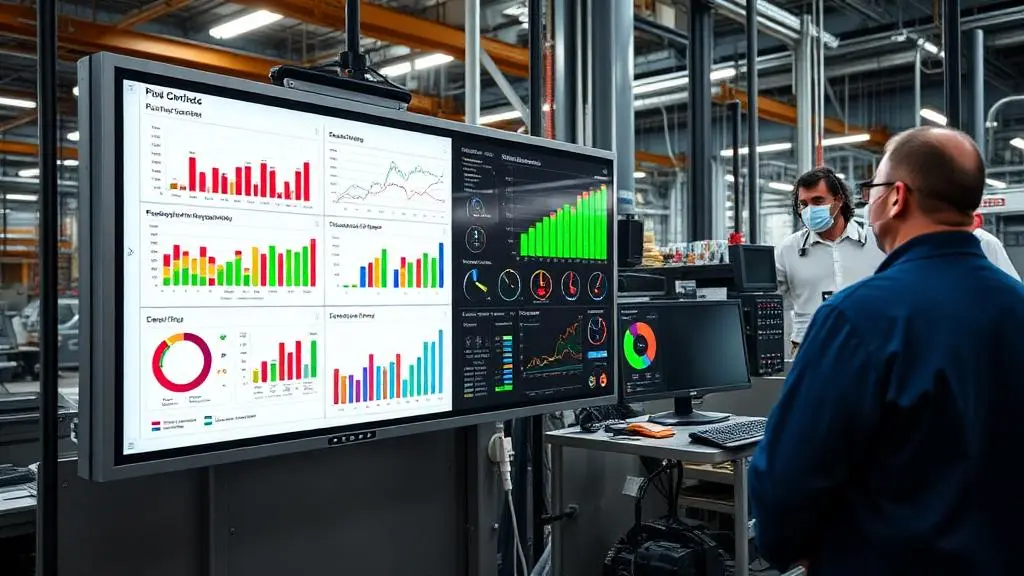
Visual management tools are the boards, signals and controls that make the status of work visible at a glance, so anyone can tell normal from abnormal without asking. The main ones are tier boards and SQDC boards, huddle boards, andon lights, kanban cards, kamishibai boards, 5S controls such as floor markings and shadow boards, and digital boards showing live data.
At a glance
- Origin: the Toyota Production System, where the workplace was designed to be self-explaining.
- Where they are used: factory floors, warehouses, hospitals, laboratories and offices, wherever a team needs to see its own performance.
- Cadence: boards are reviewed in a daily tier meeting; andon and kanban signals work in real time through the shift.
- The test of a good one: a new person can read it in under ten seconds, and a red status triggers a known response.
What is visual management?
Visual management is the use of visual signals, displays and controls to communicate information at a glance. The goal is to create an environment where anyone can walk into a workspace and immediately understand:
- What should be happening
- What is actually happening
- Whether there is a gap between the two
Visual management originates from the Toyota Production System, where it was used to make the production process self-explaining: if a part, a machine or a person was out of place, everyone could see it. It became a core part of lean manufacturing and is closely tied to quality control, because a defect or a drifting process that is visible gets contained before it reaches the customer.
The principle now applies everywhere, from factory floors to office environments and from frontline operations to executive boardrooms. This guide is about the tools themselves; for the thinking behind them, read the role of visual management in lean methodology.
Why does visual management work?
Humans process visual information far more quickly than text or speech. A well-designed visual display communicates in seconds what might take minutes to explain verbally. This speed matters in operations where a timely response to abnormalities can prevent small issues from becoming big problems.
Visual management also:
- Democratises information: everyone sees the same data, reducing information asymmetry between management and frontline workers
- Drives accountability: when performance is visible, teams naturally take ownership
- Enables rapid response: abnormalities are spotted quickly, enabling faster intervention
- Supports standard work: visual aids make standards easier to follow and deviations easier to spot
What are the main visual management tools?
Most visual management tools fall into a handful of families. You don't need all of them at once; start with the ones that solve a problem your team actually has.
| Tool | What it makes visible | Where it is used |
|---|---|---|
| Tier board or SQDC board | Safety, quality, delivery, cost and people measures against target, with open actions | The daily tier meeting at the line, rolled up to site level |
| Huddle board | The team's plan for the shift, today's issues and who owns them | A short stand-up at the start of the shift |
| Andon | A call for help or a stopped process | The operator signals an abnormality; the team leader responds |
| Kanban | When to make or move work, and limits on work in progress | Pull replenishment and workflow boards |
| Kamishibai board | Whether standard checks and audits have been done on their cycle | Leader standard work and layered audits |
| 5S and visual controls | Where things belong and what "good" looks like | Floor markings, shadow boards, colour coding, min and max lines |
| Digital boards | Live measures, actions and escalations across teams and sites | Screens in the work area, plus remote access |
5S
5S is the foundation that makes every other visual tool work. Its five steps are:
- Sort: remove what isn't needed in the area.
- Set in order: give everything a marked, labelled home, close to the point of use.
- Shine: clean the area, and use cleaning as an inspection.
- Standardise: write down and display what "good" looks like, often with photos.
- Sustain: audit regularly so the standard doesn't drift.
Once a workplace is organised this way, a missing tool or an overflowing bin is obvious at a glance. See what is 5S for more detail.
Visual controls
Visual controls go a step further than displays: they guide or limit what people do. Floor markings show walkways and where stock belongs. Colour coding separates good from rejected product. Shadow boards show which tool belongs where. Min and max lines on a rack show when to reorder. The aim is to make the right action easy and the wrong one obvious. A workplace built this way is often called a visual factory.
Andon
An andon is a signal, usually a light, a cord or a button, that an operator uses to call for help when something goes wrong in the production process. The point is not the light itself but the response behind it: a team leader comes quickly, and the problem is contained at the source. More in what is andon.
Kanban
Kanban uses cards, bins or board columns to signal when to make or move something, so work is pulled by real demand rather than pushed by forecast. On a kanban board, the columns show the flow of work and limits on work in progress make bottlenecks visible.
Kamishibai boards
A kamishibai board holds a card for each standard check or audit, turned from red to green as the check is done on its cycle. It makes leader standard work and layered audits visible: a card still red at the end of the shift is a missed check that anyone can see. More in what is a kamishibai board.
Tier boards
Tier boards bring performance, problems and actions together for a daily stand-up meeting. Frontline boards usually track safety, quality, delivery and cost against target, the SQDC board layout, and link to the next level up so issues can be escalated. A huddle board is the simpler version used at the start of a shift. These are the visual management tools most teams start with, and the ones that connect all the others. For the main board types and what to put on them, see what is a visual management board.
How do you choose the right visual management tools?
A few practical tests help when deciding what to put up:
- Does it answer a question the team asks every day? If not, leave it off.
- Can someone new read it in under ten seconds? If not, simplify it.
- Does a red status trigger a known response? A signal with no response is just decoration.
- Who updates it, and when? If nobody owns it, it will go stale within weeks.
What types of visual management display are there?
Performance displays
Boards, screens or dashboards showing key metrics: safety incidents, quality rates, production output, delivery performance. These are typically reviewed in daily tier meetings.
Process controls
Visual signals that indicate the status of a process: traffic light indicators, andon boards, kanban signals. These enable real-time response to abnormalities.
Standard work displays
Visual instructions, one-point lessons and standard operating procedures displayed at the point of use. These support consistent execution of standard work.
Problem-solving displays
A3 reports, action tracking boards and root cause analysis displays that make improvement activity visible to the team.
Should visual management boards be physical or digital?
Traditionally, visual management relied on physical boards: whiteboards, printed charts, sticky notes. While physical boards have their advantages (tactile interaction, simplicity), they also have limitations:
- Information becomes stale if not updated regularly
- Remote team members can't see the boards
- Historical data is lost when boards are cleared
- Scaling across multiple sites is difficult
Digital tools address these limitations while preserving the core principle: making information visible, timely and actionable. Most sites end up with a hybrid. Floor markings, shadow boards and andon lights stay physical, while performance boards and action tracking move to screens in the work area, so the board is still visible to everyone who walks past.
How do visual management tools fit tiered daily management?
Visual management is most powerful when embedded in a tiered daily management structure, where each tier runs its meeting from its own board:
- Tier 1: frontline teams review their visual boards daily, identifying issues and tracking actions
- Tier 2: supervisors and managers review aggregated visual data, triaging cross-functional issues
- Tier 3: senior leaders review site-wide visual dashboards, connecting daily operations to strategic goals
At each tier, the visual display should answer three questions: Where are we? Where should we be? What are we doing about the gap? Tiered meetings with visual management shows how the information flows between the tiers.
How do you get started with visual management?
- Identify the critical few metrics that matter most to your team's performance
- Make them visible, whether on a physical board or digital display, where the team gathers daily
- Review them daily in structured tier meetings
- Act on abnormalities by logging issues and tracking countermeasures
- Iterate: adjust what you display based on what drives the most value
How TeamAssurance helps
TeamAssurance is shop floor management software that runs digital tier boards, measures, actions and escalations in one live system. Teams build their daily meeting agenda into a live tier board in about five minutes, enter a measure once at the frontline and see it update on every board, and escalate what they cannot fix to the next tier, where higher tier boards aggregate data from multiple teams and sites in real time. See tiered daily management for how the tiers connect.
Frequently asked questions about visual management tools
What are the main visual management tools?
Tier boards and SQDC boards, huddle boards, andon lights and boards, kanban cards and boards, kamishibai audit boards, 5S controls such as colour-coded floor markings and shadow boards, standard work displays and digital boards. Each one makes a standard or a status visible so that a deviation is obvious to anyone.
What is the difference between a visual management board and a dashboard?
A dashboard reports numbers, usually to management. A visual management board is owned by the team that uses it, shows targets against actuals alongside the actions being taken, and is reviewed in a standing meeting every day. The board exists to trigger a response, not just to inform.
What is 5S visual management?
5S visual management is the visual side of a 5S workplace: labelled locations, floor markings, shadow boards and photos of the standard condition, set during the Set in order and Standardise steps. Once everything has a marked home, a missing tool or an overflowing bin is obvious at a glance, so 5S is the foundation for the other tools.
How do you implement digital visual management boards?
Start with the board the team already uses: the same few measures, the same action list and the same escalation path. Put it on a screen where the team meets, keep the daily review, and let the software do the collecting and aggregating. Change the layout only once the routine is stable; the meeting habit matters more than the display.
What is the purpose of visual management in lean?
To make abnormal conditions visible immediately, so problems are seen and acted on at the source rather than discovered later in a report. It also removes the need to ask for status: the board shows it, which frees the daily meeting to focus on the gaps and the actions to close them.
Part of the Connected C.I. Framework
Visual management doesn't exist in isolation. It's the communication layer that connects daily management, problem solving, standard work and strategy deployment.
If you're a business in need (or a consultant with clients in need) and you'd like to explore how digital visual management can transform your operations, contact us for a demonstration of the TeamAssurance platform today.