
OEE Software: Turn Equipment Losses into Daily Actions
OEE software calculates overall equipment effectiveness (availability x performance x quality) for each machine or line and shows where production time is lost. TeamAssurance is the daily management layer around it: OEE and loss data are reviewed on the tier board, and every loss becomes an action with an owner, a due date and a follow-up.
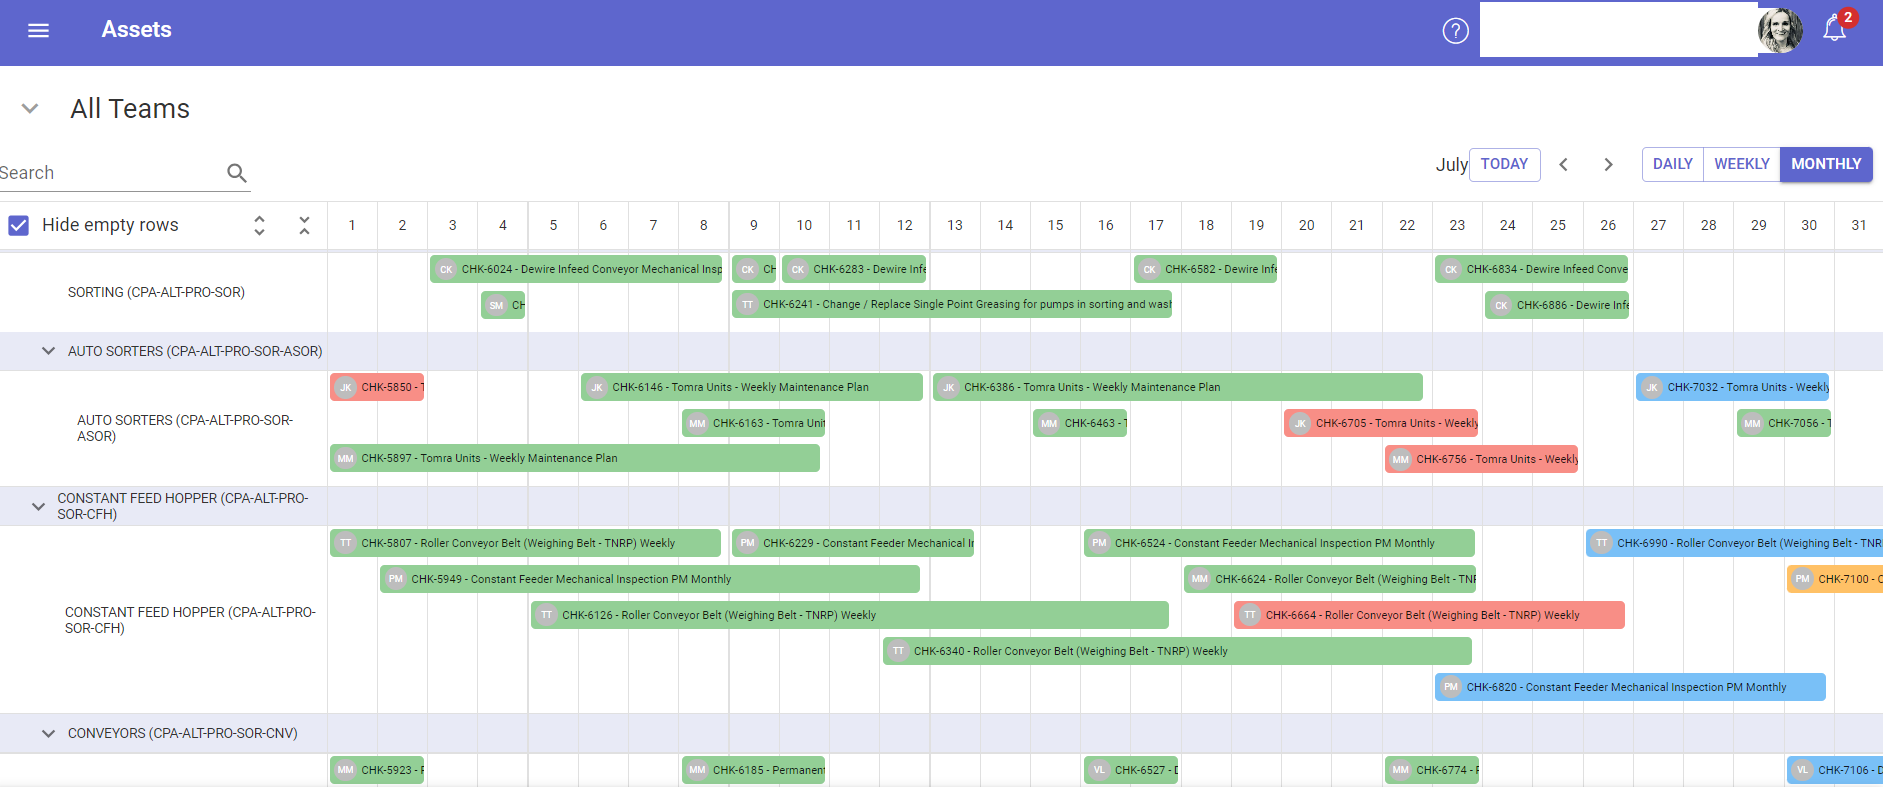
The basics
What is OEE software?
OEE software is a tool that measures overall equipment effectiveness: the share of planned production time a machine spends making good product at its designed speed. It combines three factors, availability, performance and quality, into one percentage, and breaks the gap to 100% into losses such as breakdowns, changeovers, small stops, slow running and scrap. Manufacturers use it to find which loss to attack first on a machine, line or constraint.
There are two broad kinds of OEE software. Machine-connected systems collect run, stop and count data automatically from equipment, so the OEE number is calculated in real time. Simpler tools let operators log stops and counts by hand or in a spreadsheet. Either way, the number alone does not improve anything. Improvement happens when someone looks at the biggest loss, agrees a cause and owns the fix.
That is the gap TeamAssurance fills. It is a daily management platform, not a machine-monitoring system, so it does not replace the sensors or the system that calculates OEE. It makes sure the figures, and the losses behind them, are reviewed at the start of each shift on the tier board, and that every equipment problem is raised as an action, escalated when the team cannot fix it and followed up until it is closed.
What it does
What to look for in OEE software
Availability, performance and quality shown separately
One OEE percentage hides where the loss is. Look for software that splits it into the three factors so the team can see which one is holding the machine back.
Losses classified by reason
Stops and slow running need a reason code, such as breakdown, changeover or waiting for material, so the biggest loss can be ranked and worked on first.
Connection to existing equipment data
OEE needs run, stop and count data. In TeamAssurance, equipment data from existing systems can be connected into the same daily rhythm as the rest of the area's measures.
Trend against the machine's own history
OEE is most useful compared with the same line last week or last month, not with another plant that defines losses differently.
Actions with owners and due dates
A dip in OEE should end in an action. TeamAssurance records each equipment issue with an owner and due date and tracks it until it is closed.
Escalation when the team cannot fix it
Problems the shift cannot solve, such as a recurring breakdown, move up through the tier meetings with their context rather than being lost between shifts.
Autonomous maintenance checks
Operator cleaning, inspection and lubrication checks are scheduled as standard checklists, and abnormalities raised become tracked actions.
Preventive maintenance in the same system
Planned maintenance and asset records sit alongside the daily measures, so production and maintenance work from one picture.
Compared
Spreadsheet, standalone OEE tool or TeamAssurance?
| Capability | Spreadsheet or whiteboard | Standalone OEE tool | TeamAssurance |
|---|---|---|---|
| OEE and its three factors shown for each machine or line | |||
| Equipment data from existing systems connected | |||
| Losses reviewed in the team's daily tier meeting | |||
| Every loss raised as an action with an owner and due date | |||
| Escalation of unresolved problems through the tiers | |||
| Autonomous and preventive maintenance in the same system | |||
| Repeat losses linked to structured problem solving |
How it works
How OEE improvement runs in TeamAssurance
- 01
Show the numbers
OEE and the losses behind it appear on the area's tier board alongside safety, quality, delivery and cost.
- 02
Review at the shift start
The team looks at the biggest loss from the last shift in the daily meeting and agrees what to do about it.
- 03
Assign the action
The fix becomes an action with an owner and due date. Anything the team cannot control escalates to the next tier.
- 04
Solve repeat losses
A loss that keeps coming back moves into five whys, fishbone or A3 so the cause is removed, then the trend confirms the gain holds.
Use cases
Where teams use OEE software
- Packaging and filling lines reviewing changeover and small-stop losses every shift
- Machining cells tracking availability on the constraint machine
- Food and beverage plants comparing a line's OEE with its own history
- Plants running total productive maintenance (TPM) with operator-led checks
- Multi-shift operations handing equipment issues from one shift to the next
- Multi-site manufacturers reviewing loss trends by line and by site
FAQ
OEE software FAQ
What is OEE software?
OEE software measures overall equipment effectiveness for a machine or line: availability x performance x quality. It shows how much planned production time is truly productive and which losses, such as breakdowns, changeovers, small stops and scrap, account for the rest.
How is OEE calculated?
Multiply availability (run time divided by planned production time), performance (ideal cycle time x total count, divided by run time) and quality (good count divided by total count). For example, 90% availability, 95% performance and 98% quality gives an OEE of about 84%.
What features should OEE software have?
The three factors shown separately, losses classified by reason, a trend against the machine's own history, a way to connect equipment data, and a route from each loss to an owned action. The last one matters most, because a number nobody acts on does not improve.
Is TeamAssurance OEE software?
TeamAssurance is a daily management platform with asset management built in. OEE and equipment losses are reviewed on the tier board, and equipment data from existing systems can be connected. Its role is to turn the losses into actions, escalation and follow-up, rather than to replace machine-monitoring sensors.
What is a good OEE score?
There is no single target, because it depends on the process and on how losses are defined. Most teams compare a line with its own history and focus on the loss that is holding it back, rather than chasing another plant's figure.
Who should use OEE software on site?
Operators, maintenance and supervisors share it. Operators see small stops first, maintenance fixes the causes, and leaders review the trend and remove barriers in the daily and weekly tier meetings.
Guided tour
See how oee and equipment losses fits the connected operation
A five-minute walkthrough of strategy, improvement and daily management on one system: the tier boards, the actions, the escalations and the problem solving, with worked examples from the floor up.
Learn more
Definitions
Turn OEE losses into actions your team closes
Book a demo and we will show an equipment loss reviewed on a tier board, raised as an action and escalated when the team cannot fix it.
Request a Demo